The Tax Cuts and Jobs Act of 2017 (the “Act”), perhaps the biggest legislative victory of the Trump Administration to date, re-wrote much of the country’s tax code, lowering both individual and corporate tax rates while amending various deductions for the first time in over thirty years. Initially, media and public attention were largely focused on the long-term implications for the national debt, as well as the controversial removal of the state and local tax (“SALT”) deduction. While the removal of the SALT deduction is sure to impact segments of the U.S. housing market, another aspect of the legislation could have serious consequences for housing as well. The Act established incentives for taxpayers to invest in “Qualified Opportunity Zones”, communities the Treasury Department deems economically distressed, in an effort to spur economic development in low-income areas. Opportunity Zones have recently garnered much media attention as skeptics argue that many communities benefiting from the policy, in areas such as Silicon Valley and Chapel Hill, are in no way disadvantaged. Meanwhile, many large funds have rushed to take advantage of the program as the number of Opportunity Zone funds has increased significantly in recent months. In this piece we outline the specifics of the Opportunity Zone program while discussing potential benefits to structured credit markets.
The Tax Cuts and Jobs Act of 2017 attempted to increase economic development in the U.S. not only through its core revisions to the individual and corporate tax brackets but also through the establishment of various tax incentives for investments in traditionally overlooked regions of the country, known as “Opportunity Zones”. In order to qualify for these incentives, an investor must invest directly in these Opportunity Zones or in funds, corporations, or partnerships that hold at least 90 percent of their assets in Opportunity Zone property. Once qualified, an investor can realize these tax advantages three different ways. First, a taxpayer may elect to defer the tax on a capital gain until the end of 2026 if the capital is invested in an Opportunity Zone fund within 180 days from the date the gain was realized. Second, if the investment is held in an Opportunity Zone fund for longer than five years, there is a ten percent exclusion of the deferred gain, which increases to fifteen percent if the investment is maintained for an additional two years. Lastly, there is no tax on appreciation if the qualified investment is held for at least ten years. For example, a taxpayer who makes a $10 million investment in an Opportunity Zone fund in 2018 and sells the investment for $15 million in 2029 would not pay taxes on the appreciated $5 million, a savings of over $1 million at current Federal capital gains rates.
These tax deferral and savings incentives were designed to generate trillions of dollars in unrealized capital gains while benefitting communities through investments in both direct real estate and businesses. Qualified Opportunity Zone “property” has been defined to include both tangible property as well as stock or partnership interests of a trade or business within an Opportunity Zone. However, the requirements for a qualified business investment are more stringent than those for actual real estate. A qualified real estate investment must either bring new property to the community or make substantial improvements to existing properties, defined as improvements equal in value to the property’s purchase price, excluding land value, over a 30-month period. As a result, the program has so far predominately facilitated commercial real estate investments in targeted areas.
The first set of Opportunity Zones, nominated by individual states and certified by the Treasury Department, was designated on April 9, 2018. Initially covering parts of eighteen states, the program later expanded to over 8,700 census tracts two months later, reaching all fifty states, Washington D.C., and five U.S. territories. These designated zones include low-income communities, as well as communities adjacent to Opportunity Zones where the median family income does not exceed 125 percent of the median family income of the neighboring designated zone. There are limitations on the number of tracts a state can designate, though. No more than 25 percent of low-income census tracts in a given state may be designated as Qualified Opportunity Zones, ensuring concentration of benefits in a limited number of communities.
While the program’s effectiveness at benefiting truly disadvantaged areas has been called into question, the newly established tax incentives have attracted considerable investor capital to Opportunity Zones. An estimated $20 billion flowed into Opportunity Zone real estate in the first six months after the program’s inception and 136 dedicated Opportunity Zone funds had been created as of mid-2019. The influx of capital has been pushing property valuations upward within these zones. According to a recent study, vacant land values in designated zones are up an average of 20 percent while existing properties targeted for redevelopment have seen a 14 percent price hike.
Rising real estate prices in Opportunity Zones will naturally have implications for certain fixed income instruments. Commercial mortgage-backed securities (“CMBS”) are presumably the product most directly impacted by the Opportunity Zone program given the program’s emphasis on commercial real estate investment. Many delinquent loans in existing CMBS are located in Opportunity Zones, including several large struggling malls in the Northeast and office building complexes in the Midwest. These properties could benefit from increased capital flows, minimizing projected losses to the benefit of bondholders.
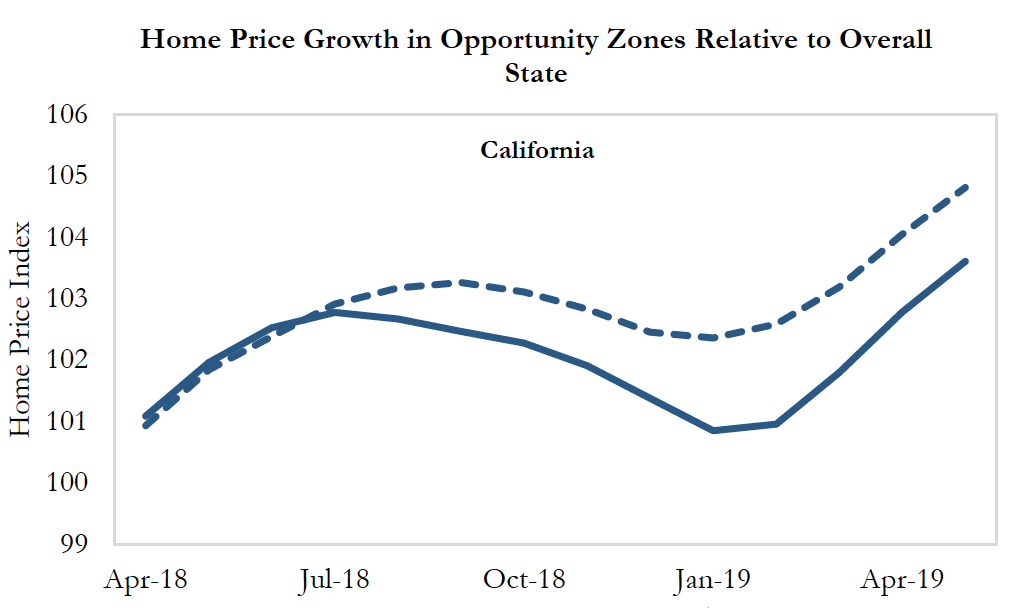
However, it is not just commercial real estate markets that have felt the positive impact of the program. Residential housing markets have experienced the program’s intended effects as well. This is not entirely surprising as the development of new commercial properties in addition to the improvement of existing business-oriented real estate should promote job creation, thus placing upward pressure on home prices in these areas. In the first fifteen months of the program, home price appreciation in Opportunity Zone Census tracts has generally been faster than that of their respective states overall, particularly in California, New Jersey, and Florida.
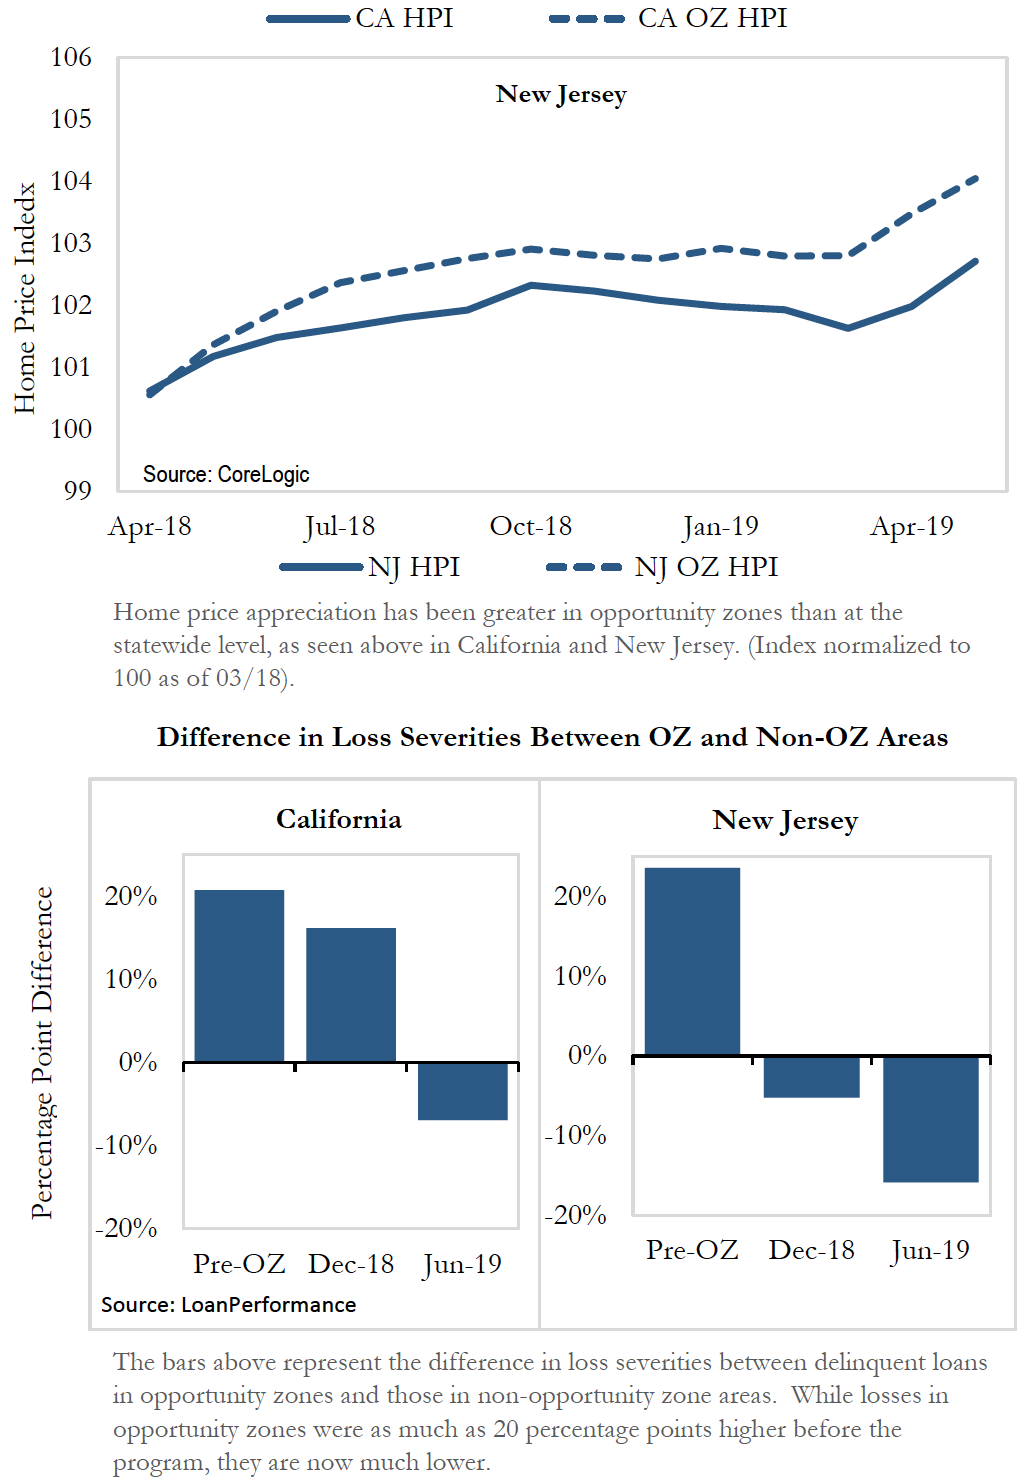
This targeted home price growth is of particular relevance to the non-agency residential mortgage-backed securities (“RMBS”) sector, as loss severities on delinquent loans is a large driver of security valuation. Since the program’s inception, severity rates on delinquent residential loans in Opportunity Zones have decreased in both absolute terms and on a relative basis when compared to those in non-Opportunity Zones, controlling for a variety of loan-level characteristics. Severity rates in designated tracts were significantly higher than other areas prior to the Opportunity Zone program, reflecting the economically distressed status of these areas. In recent months, though, severity rates in designated zones have not only decreased but have actually fallen below, rather than in-line, with local averages. This trend suggests that the residential housing effects of Opportunity Fund investments have strengthened with time, which should warrant focus on securities backed by a higher-than-average percentage of mortgages in designated zones.
On the other hand, the impact of the Opportunity Zone program on agency RMBS has thus far been muted. Agency RMBS are more heavily impacted by prepayment speeds rather than mortgage defaults and recoveries. Though there are lower order effects of home price appreciation on increased prepayment speeds, data suggests prepayment speeds in Opportunity Zones have not been faster than those in non-Opportunity Zones on a statistically-significant level.
Going forward, the positive effects of the Opportunity Zone program on structured credit markets are likely to strengthen in the near-term as capital continues to flow into these zones. That being said, the legislation is currently structured with a static time horizon; taxpayers must invest by the end of the year if they want to incur the full tax benefits from holding the investment for seven years before the tax is triggered at the end of 2026. Although there is the possibility of extension, these positive impacts are likely to dissipate without continued capital flows to these areas once the program ends.
Important Notes These materials have been provided for information purposes and reference only and are not intended to be, and must not be, taken as the basis for an investment decision. The contents hereof should not be construed as investment, legal, tax or other advice and you should consult your own advisers as to legal, business, tax and other matters related to the investments and business described herein.
Investors should carefully consider the investment objectives, risks, charges and expenses of the Ellington Income Opportunities Fund. This and other important information about the Fund are contained in the Prospectus, which can be obtained by contacting your financial advisor, or by calling 1-855-862-6092. The Prospectus should be read carefully before investing. Princeton Fund Advisors, LLC, and Foreside Fund Services, LLC (the fund’s distributor) are not affiliated. Investing involves risk including the possible loss of principal.
The information in these materials does not constitute an offer to sell or the solicitation of an offer to purchase any securities from any entities described herein and may not be used or relied upon in evaluating the merits of investing therein.
The information contained herein has been compiled on a preliminary basis as of the dates indicated, and there is no obligation to update the information. The delivery of these materials will under no circumstances create any implication that the information herein has been updated or corrected as of any time subsequent to the date of publication or, as the case may be, the date as of which such information is stated. No representation or warranty, express or implied, is made as to the accuracy or completeness of the information contained herein, and nothing shall be relied upon as a promise or representation as to the future performance of the investments or business described herein.
Some of the information used in preparing these materials may have been obtained from or through public or third-party sources. Ellington assumes no responsibility for independent verification of such information and has relied on such information being complete and accurate in all material respects. To the extent such information includes estimates or forecasts obtained from public or third-party sources, we have assumed that such estimates and forecasts have been reasonably prepared. In addition, certain information used in preparing these materials may include cached or stored information generated and stored by Ellington’s systems at a prior date. In some cases, such information may differ from information that would result were the data re-generated on a subsequent date for the same as-of date. Included analyses may, consequently, differ from those that would be presented if no cached information was used or relied upon.
AN INVESTMENT IN STRATEGIES AND INSTRUMENTS OF THE KIND DESCRIBED HEREIN, INCLUDING INVESTMENT IN COMMODITY INTERESTS, IS SPECULATIVE AND INVOLVES SUBSTANTIAL RISKS, INCLUDING, WITHOUT LIMITATION, RISK OF LOSS.
Example Analyses Example analyses included herein are for illustrative purposes only and are intended to illustrate Ellington’s analytic approach. They are not and should not be considered a recommendation to purchase or sell any financial instrument or class of financial instruments.
Forward-Looking Statements Some of the statements in these materials constitute forward-looking statements. Forward-looking statements relate to expectations, beliefs, projections, estimates, future plans and strategies, anticipated events or trends and similar expressions concerning matters that are not historical facts. The forward-looking statements in these materials are subject to inherent qualifications and are based on a number of assumptions. The forward-looking statements in these materials involve risks and uncertainties, including statements as to: (i) general volatility of the securities markets in which we plan to trade; (ii) changes in strategy; (iii) availability, terms, and deployment of capital; (iv) availability of qualified personnel; (v) changes in interest rates, the debt securities markets or the general economy; (vi) increased rates of default and/or decreased recovery rates on our investments; (vii) increased prepayments of the mortgage and other loans underlying our mortgage-backed or other asset-backed securities; (viii) changes in governmental regulations, tax rates, and similar matters; (ix) changes in generally accepted accounting principles by standard-setting bodies; (x) availability of trading opportunities in mortgage-backed, asset-backed, and other securities, (xi) changes in the customer base for our business, (xii) changes in the competitive landscape within our industry and (xiii) the continued availability to the business of the Ellington resources described herein on reasonable terms.
The forward-looking statements are based on our beliefs, assumptions, and expectations, taking into account all information currently available to us. These beliefs, assumptions, and expectations can change as a result of many possible events or factors, not all of which are known to us or are within our control. If a change occurs, the performance of instruments and business discussed herein may vary materially from those expressed, anticipated or contemplated in our forward-looking statements.
PRINCF-20191003-0035