Introduction
The most recent round of quantitative easing has flooded the fixed income markets with cash, pushing the most commoditized sectors of the bond market to historically low yields and tight spreads.
Bond investors with allocations to corporate-focused funds have experienced very strong returns over the past twelve months which may come at the expense of potentially volatile returns going forward. Put another way, asset prices are significantly higher, and corporate yields are through record lows, leaving much more downside than upside.
The Ellington Income Opportunities Fund has performed well year to date, achieving a total net return of 6.17% through the end of May 2021 (EIOMX). This return was achieved without significant exposure to traditional corporate credit assets which performed extremely well during this timeframe. By investing in less commoditized sectors of the bond market that exhibit lower beta to the broader equity and credit markets, the Ellington Income Opportunities Fund seeks higher and more stable yields over a long-term horizon. These non-traditional sectors include residential mortgage bonds, commercial mortgage bonds, collateralized loan obligations, and asset-backed securities.
2020 Fund Review
While the fund ended last year on a strong note, it did not escape the turbulence of March 2020. The fund drew down approximately 18% at its low point as the COVID pandemic crippled financial markets, especially the structured credit markets where the fund invests. Although there were broad fundamental concerns early in the pandemic regarding many of the fund’s asset classes, such as whether borrowers could continue to make mortgage payments, much of the fund’s price drawdown was due to technical factors. Forced selling of assets by other market participants, whether because of fund redemptions or margin calls, was met with little demand from banks and Wall Street dealers. Initial price declines triggered more margin calls, which led to more selling from levered accounts and so on, eventually causing a vicious downward cycle of falling prices. At one point in March, spreads on fundamentally sound structured credit assets widened as much as 1500 basis points in a matter of days.
There was nowhere to hide for an investor owning these securities and the Ellington Income Opportunities fund was no exception. However, the fund’s performance was strong on a relative basis as peer funds in the U.S. operating under similar liquidity terms were down as much as 40% in March. The main reason for this outperformance stemmed from the typical asset profile owned by the fund. While traditional leverage through repurchase agreements is not allowed under UCITS regulations, unlevered assets with embedded structural leverage can prove just as dangerous. The fund’s strategy has always focused on senior, stable profiles of structured credit assets that trade at attractive spreads due to non-fundamental reasons.
The legacy Residential Mortgage-Backed Security (RMBS) market is perhaps the best example of this security type. Losses during the 2008 financial crisis ate through credit subordination on most of these deals, triggering downgrades on senior investment grade (IG) tranches. In fact, the majority of previously IG tranches are now loss-taking securities, eliminating much of their pre-2008 investor base that required zero-loss bonds with maximum ratings. Additionally, from a capital perspective for most dealers, the loss-taking nature of the securities makes them expensive to hold on the balance sheet. As a result, the sector trades at attractive spreads, despite the low loan-to-value (LTV) ratios of its underlying mortgages and steep price discounts on securities, which ultimately insulate an investor’s initial capital outlay from losses if held to maturity.
A senior-most, seasoned bond backed by mortgages with LTV ratios as low as 50% can withstand severe shocks, even those projected early in the pandemic. While prices of these assets still fell, as did all credit products given the extra spread demanded by investors at the time, the projected loss increase on a security basis was quite low. These price moves can be contrasted to those on a subordinate security during the same period, such as tranche from a Credit Risk Transfer (CRT) deal. In such a security, an investor is exposed to the first few percent of losses on a pool of mortgages that were projected to take significant write-downs due to the pandemic. As a result, certain tranches of these deals were down as many as 80 points in March 2020, with limited clarity on the actual depth of the market. By avoiding these securities with embedded leverage, the fund did not experience many of these incredibly steep price declines.
The same theme applies to the fund’s investments in Collateralized Loan Obligations (CLO) and Commercial Mortgage-Backed Securities (CMBS). For example, robust scenario analysis on the fund’s levered loans, calibrated from live market pricing and volatility data, is run daily to screen for asymmetric downside risk in CLO structures. Deep loan-level credit work, utilizing tools built for riskier first-loss CMBS tranches, is applied to the analysis of the more senior CMBS assets owned in the fund. These tools and analyses ensure the fund owns assets where price declines are typically a function of spread widening not increased fundamental risk.
Finally, an important point to touch upon regarding 2020 is fund liquidity. Historically, many investors have expressed worry regarding the liquidity of structured credit assets, especially in times of distress. The roller-coaster events of 2020 should help quell these concerns. It is no secret that the fund saw a decline in AUM during the spring of 2020, as did many other fixed-income vehicles, as investors chose to re-allocate or increase levels of cash. At one point, the fund’s NAV had fallen over 70%. However, we were able to sell assets in an orderly fashion with minimal impact on performance. In many ways, the events of COVID created a worse liquidity event for the structured credit markets than what transpired in 2008. The accelerated timeline over which these extreme market moves occurred, coupled with the weakened state of the dealer community, made this period extremely difficult to navigate. As a manager who is no stranger to financial crises, having lived through the events of 1998, 2008, and most recently 2020, the fund was and continues to be well-positioned to handle these liquidity events.
2021 Fund Outlook
For the last six months of 2020, markets re-priced as a result of the Federal Reserve’s quantitative easing. Interest rates stayed low and risk assets rallied in price. By now, much of the recovery in liquid credit products is largely complete, leaving investors few remaining areas to find returns. While high yield corporate credit spreads sold off in January, asset classes that lagged the broader credit rebound of 2020, such as RMBS and CLOs, tightened. These assets tend to have floating interest rate exposure, which bodes well given current market dynamics.
Market sentiment has shifted somewhat in recent months with regards to the future direction of interest rates. Inflationary fears have reversed a portion of last year’s sharp decline in interest rates, which served as a tailwind for most credit funds in 2020. The Ellington Income Opportunities fund is managed with minimal interest rate risk which clearly impacted performance relative to funds that rode the interest duration wave as rates dropped precipitously last year. However, funds that have floating interest rate exposure have benefited so far in 2021 as both interest rates and expectations of future interest rates have started to rise. We have already seen traditional bond indices, such as the Barclays U.S. Aggregate, suffer thus far in 2021, while the Ellington Income Opportunities fund is up +2.5% year to date through the end of May.
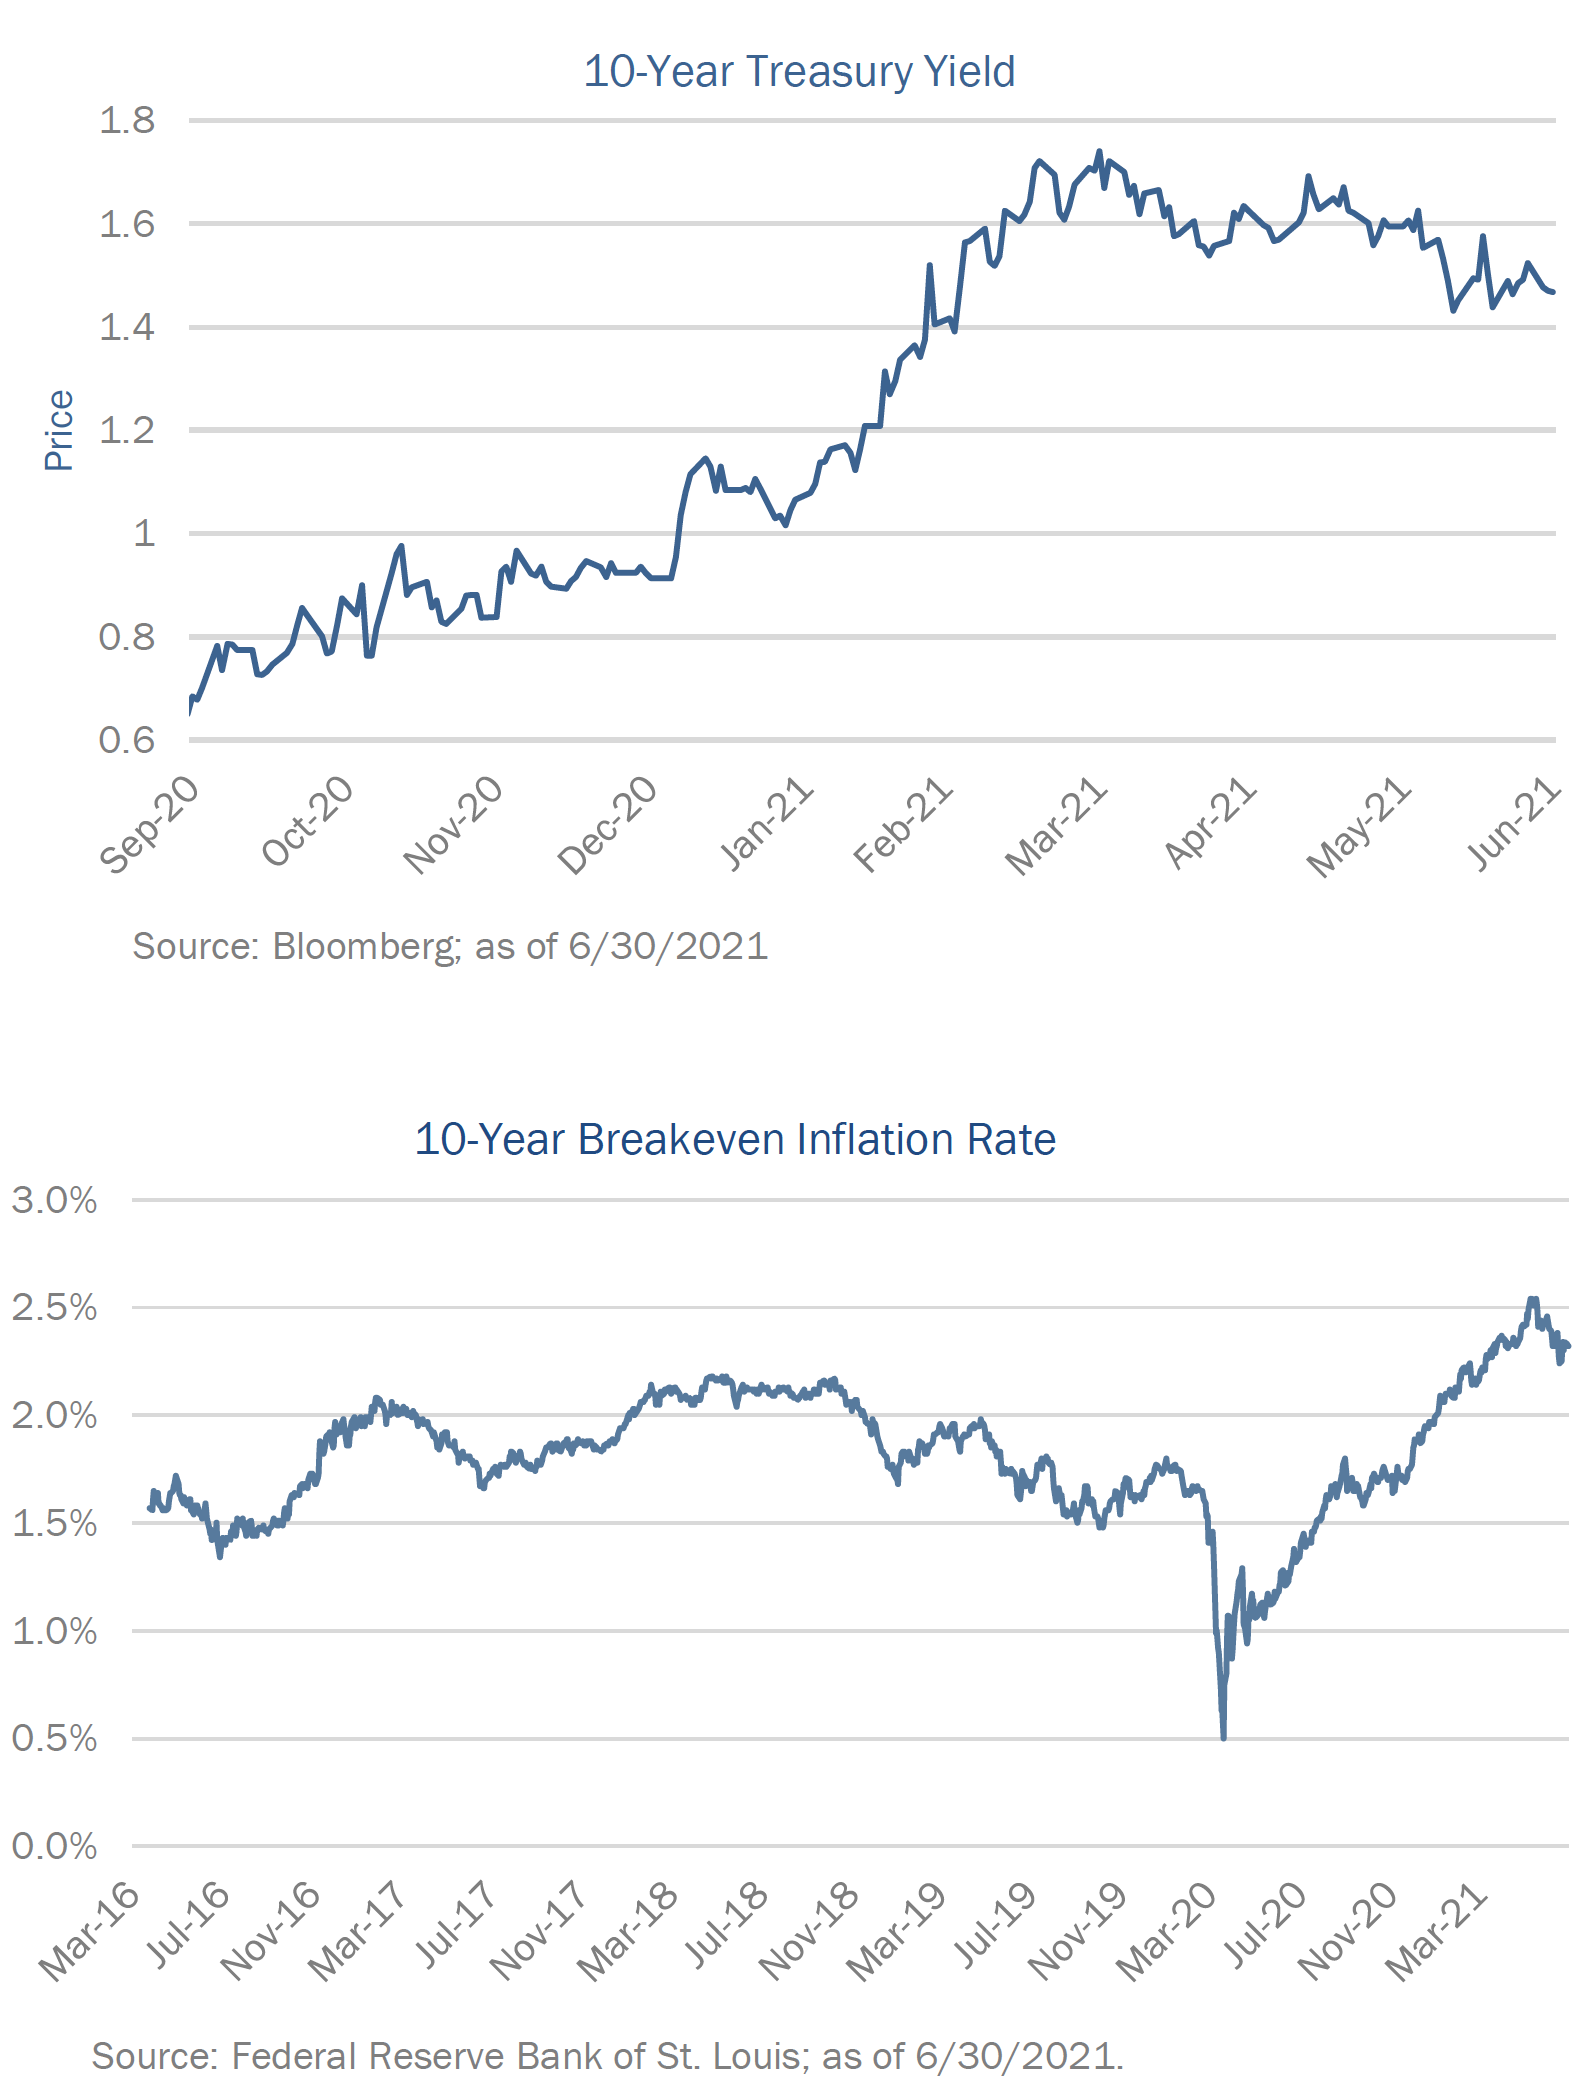
While we do not have a crystal ball to predict how high inflation will go, we do see inflation and increased interest rates as presenting problems for corporate credit markets. The yield on the U.S. 10-year Treasury note has increased nearly 70 basis points since the start of the year, which corresponds to a drop in price from 99.62 at the end of December to 93.94 at the end of May. While this may not sound like a lot, it represents almost 3.5 years’ worth of interest on the security at current rates.
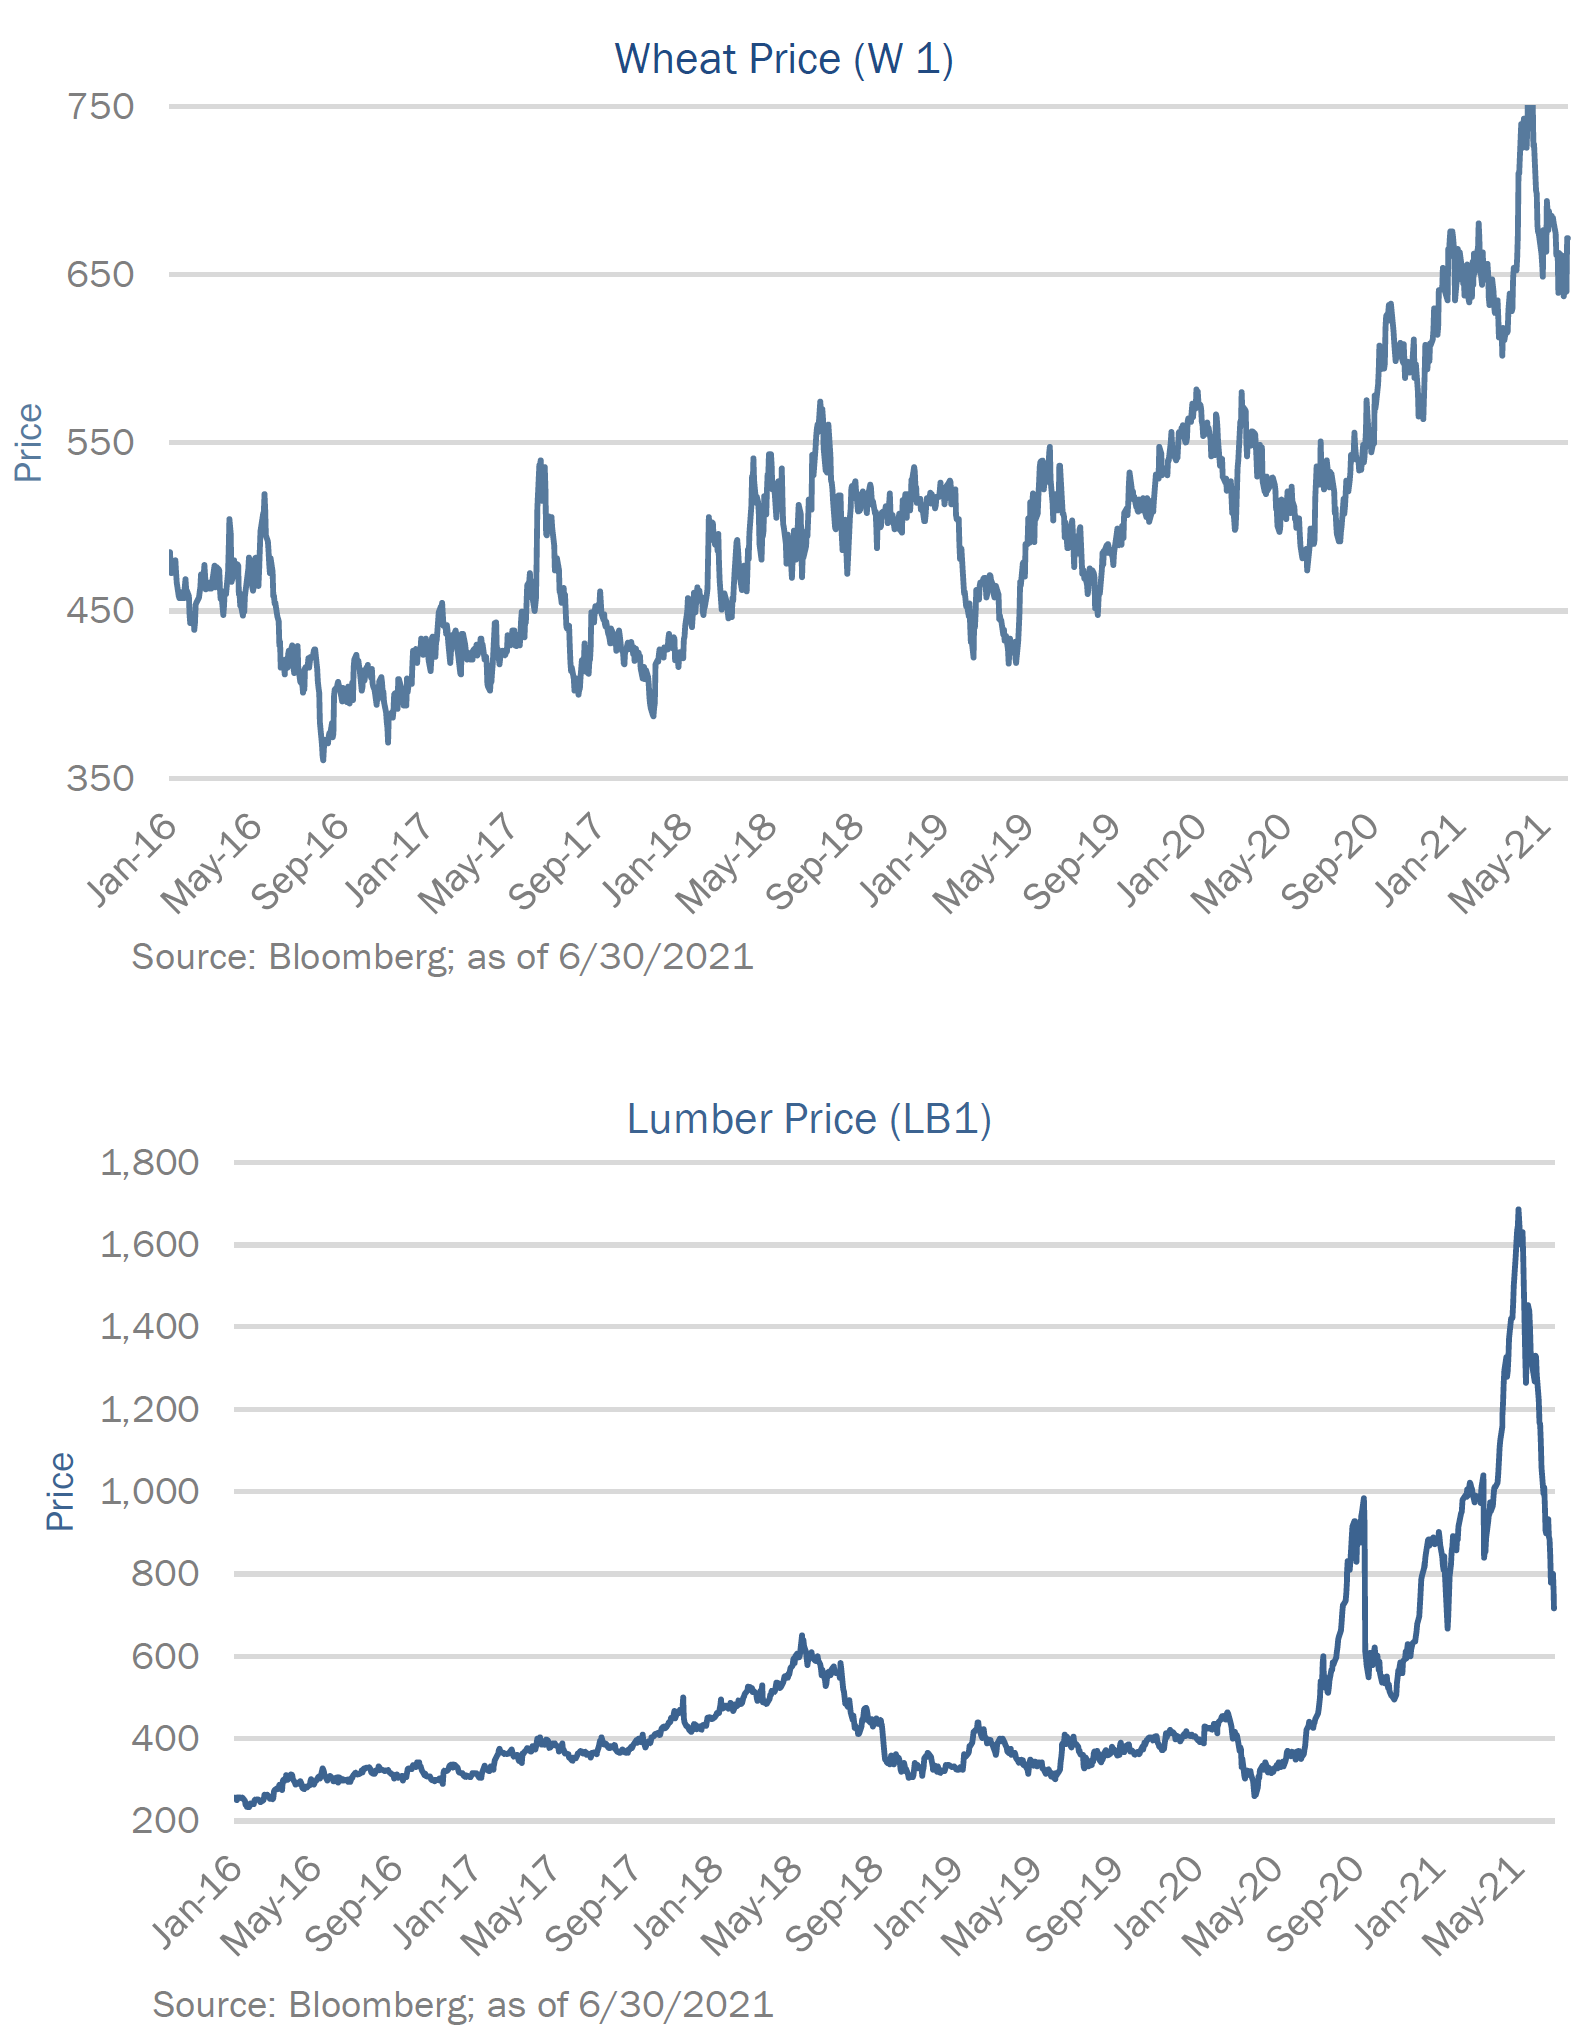
Other markets are beginning to price in an inflation wave as well. Many commodity prices are at multi-year highs. For example, lumber has gone from 300 to 1300 and wheat has gone from 450 to 725. As an added benefit, the majority of the bonds in the Ellington Income Opportunities fund are backed by either residential housing or commercial real estate, two sectors that should perform similar to commodities in an inflationary environment.
None of this means that interest rates will continue to rise with certainty, but it likely means that any material drop in interest rates will be due to a weakening recovery and will be accompanied by wider credit spreads, in sharp contrast to the last nine months of 2020. Given the fact that structured credit spreads are still relatively wide, we would expect our assets to experience less of a price decline versus other credit markets in such a scenario.
RMBS Outlook
The fund’s RMBS holdings have strong tailwinds as the U.S. housing market is one of the economic bright spots to emerge due to the pandemic. The pace of improvement in residential mortgage credit performance has exceeded expectations, owing to the strong initial rebound that followed last spring’s deep economic stress and the unexpectedly stellar performance of the housing market over recent months. Against this strong housing backdrop and further job gains, new delinquencies continue to remain at or below pre-COVID levels and aggregate delinquencies continue to steadily decline. The expectation is that they will continue to do so. Well over half of the loans that entered a COVID-19 forbearance plan have cured and estimates suggest that as many as half of those that remain delinquent are on “repayment plans”, meaning borrowers are actively paying and will eventually cure as they steadily catch up on prior missed payments. Homeowners, in large part, have remained financially resilient through the COVID crisis, with job losses overwhelmingly concentrated in lower-income sectors. Borrowers that did suffer income loss benefited from the direct consumer support included in multiple fiscal relief packages, as stimulus checks and enhanced unemployment benefits effectively replaced lost income for the majority of those facing financial distress.
With the resiliency of homeowners’ financial positions, expectations for cumulative cure rates for COVID-19 related forbearance remain very high, around 85-90% (2). Furthermore, surging demand and dwindling supply in the housing market has pushed home prices up significantly, over 13.2% higher than last year’s levels. These strong home price gains not only mitigate defaults and severities, they also markedly increase recoveries on forborne balance from the financial crisis, which can result in meaningful upside for many of these securities. Aggregate legacy RMBS severities were 15 points lower in 2021 Q1 vs 2020 Q1, while the share of no-loss liquidations has risen sharply from 12% in 2020 to 22% in 2021 YTD. Nomura expects a further decline in severities in the medium-term due to above-trend HPA and a shift in the composition of liquidations to include a greater share of previously modified loans that have shorter timelines.
CMBS Outlook
Advancements in COVID vaccines and announcements of rollout schedules dampened fundamental risks and pushed CMBS and Commercial Real Estate (CRE) CLO spreads tighter into 2021. Conduit CMBS delinquency figures ended the first quarter at 6.9%, down from 7.5% at year-end and a peak of 8.6% in June of last year. Hotel and retail continued to have the largest share of delinquent loans, comprising 75% of the total as of the end of the first quarter. Our portfolio has been concentrated in CRE CLO securities and has been more resilient than the Conduit market, with a weighted average delinquency rate of only 1.5% through the end of May.
Despite recent tightening, we still believe that the CRE CLO sector has room to run, as it offers some of the best risk-adjusted returns in the market, with high credit enhancement and strong deal sponsors limiting downside risk.
CLO Outlook
The general macroeconomic recovery and strong inflows from investors seeking exposure to floating rate assets led to significant spread compression in leveraged loans and CLOs over the last quarter. The leveraged loan index now sits at a price of 98.09, with loan spreads tighter than pre-COVID levels; this liquidity has helped to create a much more benign loan default cycle than initially expected. At the end of April, trailing 12-month default rates decreased to 2.6% (3), well below the high-single to low-double digit projections by most dealer research desks last spring. Annualized prepayment rates nearly doubled from January to April to around 45%, reducing the share of loans trading above par to 16% (down from 27% in January).
Nevertheless, several sectors of the CLO market remain wide of multi-year tights. We believe significant opportunities for tightening remain in shorter duration, structurally nuanced deals. Driven by a meaningful increase in prepayment rates, the share of loans in CLOs currently trading above par has declined, but remains elevated at 23%. In turn, significant principal pay downs have been triggered in senior, lower coupon tranches. This has caused the excess spread earned by the equity tranche to diminish, which has incentivized many equity holders to call deals. Additionally, many deals have been able to refinance liability coupons that were wider than current market levels, which has improved distributions to equity holders. Both of these events have resulted in par payoffs of debt tranches, which currently trade at discounts to par. Even in higher stress scenarios, these tranches remain resilient, as interest payments to junior debt and equity tranches are diverted to pay down and protect more senior tranches. Due to this, our portfolio has a structural profile akin to AA or better, with the spread profile of a BBB.
Conclusion
Ellington Income Opportunities fund is designed to generate an attractive total return over a market cycle. In attempting to achieve this objective, the fund has shown resistance to the past market drawdowns and has generated a high portion of return from current carry, which benefits investors in this low interest rate environment. These goals have been accomplished by investing in non-traditional segments of the bond market that exhibit low beta and correlation to the broader markets, tend to be floating rate and are higher yielding. We favor diversification across and within sectors with exposure to real assets in the residential and commercial spaces along with non-traditional structured corporate exposure. We focus on low duration assets that are generally less correlated to big moves in risk assets. If high yield bonds rally significantly, as they did in 2020, the Ellington Income Opportunities fund may underperform to some extent. However, we are positioned to potentially outperform if interest rates and inflation continue to rise, which could also be associated with a sharp pullback in corporate credit. We believe that the Ellington Income Opportunities fund is well positioned for a strong 2021 and is off to a solid start so far.
(1) Morgan Stanley, (2) Nomura, (3) S&P LCD
Investors should carefully consider the investment objectives, risks, charges and expenses of the Ellington Income Opportunities Fund. This and other important information about the Fund are contained in the Prospectus, which can be obtained by contacting your financial advisor, or by calling 1-855-862-6092. The Prospectus should be read carefully before investing.
Important Notes
These materials have been provided for information purposes and reference only and are not intended to be, and must not be, taken as the basis for an investment decision. The contents hereof should not be construed as investment, legal, tax or other advice and you should consult your own advisers as to legal, business, tax and other matters related to the investments and business described herein.
The information in these materials does not constitute an offer to sell or the solicitation of an offer to purchase any securities from any entities described herein and may not be used or relied upon in evaluating the merits of investing therein. No such offer or solicitation will be made prior to the delivery of offering and related subscription or investment advisory materials (together, the “Offering or Advisory Materials”). Offers and sales will be made only pursuant to the Offering or Advisory Materials and in accordance with applicable securities laws. The information set forth herein does not purport to be complete and is qualified in its entirety by reference to the Offering or Advisory Materials. These materials are not a part of or supplemental to such definitive Offering or Advisory Materials. These materials will be superseded in its entirety by the Offering or Advisory Materials (and any supplements thereto).
The information contained herein has been compiled on a preliminary basis as of the dates indicated, and there is no obligation to update the information. The delivery of these materials will under no circumstances create any implication that the information herein has been updated or corrected as of any time subsequent to the date of publication or, as the case may be, the date as of which such information is stated. No representation or warranty, express or implied, is made as to the accuracy or completeness of the information contained herein, and nothing shall be relied upon as a promise or representation as to the future performance of the investments or business described herein.
By acceptance hereof, you agree that (i) the information contained herein may not be used, reproduced or distributed to others, in whole or in part, for any other purpose except as expressly provided herein without the prior written consent of Ellington Global Asset Management, L.L.C. or its affiliated advisers (together, “Ellington”); (ii) the information contains highly confidential and proprietary ‘trade secrets’; (iii) you will keep confidential all information contained herein not already in the public domain; and (iv) you will not use such information for any other purpose, including trading in the securities of other Ellington entities.
Some of the information used in preparing these materials may have been obtained from or through public or third party sources. Ellington assumes no responsibility for independent verification of such information and has relied on such information being complete and accurate in all material respects. To the extent such information includes estimates or forecasts obtained from public or third party sources, we have assumed that such estimates and forecasts have been reasonably prepared. In addition, certain information used in preparing these materials may include cached or stored information generated and stored by Ellington’s systems at a prior date. In some cases, such information may differ from information that would result were the data re-generated on a subsequent date for the same as-of date. Included analyses may, consequently, differ from those that would be presented if no cached information was used or relied upon.
Performance Information
Monthly performance represents the net asset value appreciation (net of all expenses, including performance fees and allocations) as a percentage of beginning-of-month capital for an investor who had invested in the investment vehicle since its inception under the investment vehicle’s standard fee structure. Certain factors, such as the treatment of loss carryforwards, may cause monthly performance to vary from investor to investor. Thus, individual investor performance may differ from the performance reflected herein. For individual investor performance, investors should rely on information contained in account statements produced by the appropriate investment vehicle’s administrator. Performance includes re-investment of principal, interest, and dividends. Index performance is included to show the general trend in applicable markets in the periods indicated and is not intended to imply that the portfolios of the Ellington funds are similar to the index either in composition or element of risk. Please see index descriptions below for additional details.
PAST PERFORMANCE IS NOT INDICATIVE OF FUTURE RESULTS. AN INVESTMENT IN VEHICLES AND INSTRUMENTS OF THE KIND DESCRIBED HEREIN, INCLUDING INVESTMENT IN COMMODITY INTERESTS, IS SPECULATIVE AND INVOLVES SUBSTANTIAL RISKS, INCLUDING, WITHOUT LIMITATION, RISK OF LOSS. YOU SHOULD CAREFULLY REVIEW THE DISCUSSION OF RISK FACTORS IN THE RELEVANT OFFERING DOCUMENT, SUBSCRIPTION MATERIALS, OR MANAGEMENT AGREEMENT BEFORE DECIDING TO INVEST.
Forward-Looking Statements
Some of the statements in this document constitute forward-looking statements. Forward-looking statements relate to expectations, beliefs, projections, future plans and strategies, anticipated events or trends and similar expressions concerning matters that are not historical facts. The forward looking statements in this presentation involve risks and uncertainties, including statements as to: (i) general volatility of the markets in which we invest; (ii) changes in our business strategy; (iii) availability, terms, and deployment of capital; (iv) availability of qualified personnel; (v) changes in our industry, interest rates, the securities markets or the general economy; (vi) increased rates of default and/or decreased recovery rates on our investments; (vii) changes in governmental regulations, tax rates, and similar matters; (viii) changes in generally accepted accounting principles by standard-setting bodies; and (ix) availability of investment opportunities.
The forward-looking statements are based on our beliefs, assumptions, and expectations of our future performance, taking into account all information currently available to us. These beliefs, assumptions, and expectations can change as a result of many possible events or factors, not all of which are known to us or are within our control. If a change occurs, the performance of our portfolio and our business, financial condition, liquidity and results of operations may vary materially from those expressed, anticipated or contemplated in our forward-looking statements.
Risk Considerations
ABS, RMBS and CMBS are subject to credit risk because underlying loan borrowers may default. Additionally, these securities are subject to prepayment risk because the underlying loans held by the issuers may be paid off prior to maturity. The value of these securities may go down as a result of changes in prepayment rates on the underlying mortgages or loans. During periods of declining interest rates, prepayment rates usually increase and the Fund may reinvest prepayment proceeds at a lower interest rate. CMBS are less susceptible to this risk because underlying loans may have prepayment penalties or prepayment lockout periods. There is a risk that issuers and counterparties will not make payments on securities and other investments held by the Fund, resulting in losses to the Fund. In addition, the credit quality of a debt instrument by the Fund may be lowered if an issuer’s financial condition changes.
The value of the Fund’s investments in fixed income securities will fluctuate with changes in interest rates. Typically, a rise in interest rates causes a decline in the value of fixed income securities. Foreign investing involves risks not typically associated with U.S. investments, including adverse fluctuations in foreign currency values, adverse political, social and economic developments, less liquidity, greater volatility, less developed or less efficient trading markets, political instability and differing auditing and legal standards. Investing in emerging markets imposes risks different from, or greater than, risks of investing in foreign developed countries.
Lower-quality fixed income securities, known as “high yield” or “junk” bonds, present greater risk than bonds of higher quality, including an increased risk of default. An economic downturn or period of rising interest rates could adversely affect the market for these bonds and reduce the Fund’s ability to sell its bonds. The lack of a liquid market for these bonds could decrease the Fund’s share price. Repayment of defaulted securities and obligations of distressed issuers (including insolvent issuers or issuers in payment or covenant default, in workout or restructuring or in bankruptcy or insolvency proceedings) is subject to significant uncertainties. Investments in defaulted securities and obligations of distressed issuers are considered speculative as are junk bonds in general. The value of a specific security can be more volatile than the market as a whole and can perform differently from the value of the market as a whole. The value of securities of smaller issuers can be more volatile than those of larger issuers. The value of certain types of securities can be more volatile due to increased sensitivity to adverse issuer, political, regulatory, market, or economic developments. Liquidity risk exists when particular investments of the Fund would be difficult to purchase or sell, possibly preventing the Fund from selling such illiquid securities at an advantageous time or price, or possibly requiring the Fund to dispose of other investments at unfavorable times or prices in order to satisfy its obligations.
The advisor’s and sub-advisors’ judgments about the attractiveness, value and potential appreciation of particular asset classes and securities in which the Fund invests (long or short) may prove to be incorrect and may not produce the desired results. Additionally, the advisor’s judgments about the potential performance of the sub-advisor may also prove incorrect and may not produce the desired results. Overall equity and fixed income securities and derivatives market risks may affect the value of individual instruments in which the Fund invests. Factors such as domestic and foreign economic growth and market conditions, interest rate levels, and political events affect the securities and derivatives markets. When the value of the Fund’s investments goes down, your investment in the Fund decreases in value and you could lose money. Smaller companies may have limited product lines, markets or financial resources, and they may be dependent on a limited management group. Securities of smaller companies may be subject to more abrupt or erratic market movements than those of larger, more established companies or the market averages in general. Underlying funds are subject to investment advisory and other expenses, which will be indirectly paid by the Fund. As a result, the cost of investing in the Fund will be higher than the cost of investing directly in an underlying fund and may be higher than other funds that invest directly in stocks and bonds. Underlying funds are subject to specific risks, depending on the nature of the fund.
Glossary
The Breakeven Inflation Rate is a measure of expected inflation derived from 10-Year Treasury Constant Maturity Securities and 10-Year Treasury Inflation-Indexed Constant Maturity Securities. The latest value implies what market participants expect inflation to be in the next 10 years, on average.
Basis Points are a unit of measure used to describe the percentage change in the value of financial instruments or the rate change in an index or other benchmark.
A Residential Mortgage-Backed Security (RMBS) is a type of mortgage-backed debt obligation created from residential debt, such as mortgages, and subprime mortgages.
Commercial Mortgage-Backed Securities (CMBS) are a type of mortgage-backed security that is secured by mortgages on commercial properties, instead of residential real estate.
A Collateralized Loan Obligation (CLO) is a security backed by a pool of debt, often low-rated corporate loans.
Beta is a measure of the volatility or systematic risk of a security or portfolio compared to the market as a whole.
Correlation is a statistic that measures the degree to which two securities move in relation to each other.
PRINCF-20210708-0088